How to distinguish the Jaguar XJ6 and XJ8

The Jaguar XJ models of the 1990s, the X300 generation XJ6 and the X308 generation XJ8, are very similar looking cars. The key different is what’s under the bonnet – the XJ6 has a straight 6 AJ16 engine in 3.2 or 4.0 form while the XJ8 sports an 8-cylinder AJ-V8 engine in the same displacements. But what if you happen to see an XJ drive past you in the street – how can you tell whether it’s an XJ6 or an XJ8 without checking under the bonnet?

Well, there are a few tell-tale signs. This is not supposed to be an exhaustive list of the differences between the XJ6 and XJ8 – rather, a way of telling them apart at a glance.

The easiest way is to look at the badge on the back. Predictably, the XJ6 says XJ6 and the XJ8 says XJ8. But wait! There are exceptions. The Sovereign trim level of either model will just say Sovereign and not give a clue about the model of the car. Technically, it’s just called a Jaguar Sovereign, and not a Jaguar XJ6 Sovereign. Likewise the Sport trim level will be badged XJ Sport for both the XJ6 and XJ8 variants. Likewise the XJR badge will let you know there’s a supercharger on board, but not which generation you have.

So unless you have a base spec XJ6 or XJ8, the boot badge might not be much help to you.

You can also look at the registration plate of the car to try and work out the year. The XJ6 was produced from 1994 to 1997 and the XJ8 from 1997 to 2002. This means, at least for the UK, an XJ6 number plate should start with M, N, P or R, while an XJ8 number plate should start with R, S, T, V, W, X, Y, 51, 02 or 52. This is ambiguous for R (1997) and of course lots of XJs have custom/vanity plates to disguise their age.

If this still didn’t help, there are some physical differences we can check. Working from front to back, the key differences are:

The XJ6 has rectangular indicator/reflector lenses. The XJ8 has oval ones. This is probably the easiest attribute to look for, and it applies to the reflectors and running lights on the side of the car too. The XJ6 also has oval fog lights, while the XJ8 has round.

Slightly more subtle, the XJ6 has Fresnel glass on the main headlamps, while the XJ8 has clear glass.

The XJ6 has a chrome strip along the top of both bumpers. The XJ8 only has an L-shaped chrome strip around the corners. The XJ6 has a squarer front grille, while the XJ8 grille has more rounded corners.

The XJ8 has a V8 badge on the B pillar. Some XJ6s have nothing there, some say 4.0 Litre, some say 4.0 Sport, but none of them say V8! The XJ6 here is a Sovereign, and has a lot more chrome than the base spec XJ8.

The tail lights are subtly different. The XJ6 has a smoked top half, and the lower red half is flat with a matte appearance. The reflector area is square. The XJ8 tail light is not smoked at the top, appearing brighter and slightly rounder, and the reflector area is a smaller rounded square within the lower half, with a more 3D appearance.

Finally, if you get the chance to peep in the window, you can immediately tell the XJ6 and XJ8 apart from their dashboard. The XJ6 has a flat instrument cluster derived from the older XJ40. It has two large dials, four smaller ones and an array of lights and switches. The XJ8 has a simpler dashboard with three recessed binnacles for the dials. Most of the lights have been replaced by a two-line message LCD display within the speedometer.

The centre consoles also differ. The XJ6 has a rectangular bezel around the climate and audio controls, while the XJ8 has changed the bezel to a rounded shape.

The XJ8 is mine. Many thanks to Will Lyon Tupman for sharing photos of his XJ6 Sovereign. I resorted to a library photo for the XJ6 boot badge.

Jaguar XJ8 X308 rear view mirror replacement

The rear view mirror used the 1997-2002 Jaguar XJ8 (X308) and related cars like the Jaguar XK8 (X100) has a light-sensitive electrochromic auto-dimming feature which is unfortunately prone to failure. The mirror develops discoloured patches. The chemical that darkens to dim the mirror tends to move around, causing blotches of brown or black. If you’re really unlucky, the glass can crack and the highly corrosive brown liquid can drip out and damage your interior. These failures seem to happen just with age, even if the mirror has never been mistreated.

The mirror houses two light sensors (front and back) to know when it should dim. These light sensors also control the automatic headlight function, and on higher/later models there is also a rain sensor that controls the automatic wiper.

The combination of these mirrors being complex and having a high failure rate means they are now scarce, and expensive.

At some point in the production run, the mirrors changed design. As far as I know, there is no way of telling the two mirrors apart externally – the only way to know is to remove the top centre console via the screw in the sunglasses holder and check the colour of the connector. Earlier ones have a 6-pin yellow connector while later ones have an 8-pin white connector.

I’ve needed a replacement mirror for ages but have been holding off due to the high price. One popped up on eBay for a low price recently, so I snapped it up. When it arrived, I realised I’d accidentally bought the white connector type when I actually need the yellow connector type.

There is a lot of confusion on forums about compatibility, whether they can be rewired, whether you can swap the glass over and leave the wires, etc. It is possible to swap the glass over, but the mirror casing is glued together and seems quite hard to open without cracking the glass (especially if you’re clumsy and impatient like me) so I ruled that out.

I was able to find the following information about the wiring of the yellow connector:

1White+12V IGN
2GreyReverse Interrupt
3BlackGround
4YellowCell (output to exterior dimming mirrors?)
5GreenTi S (auto headlight trigger?)
6BrownHood
Yellow connector wiring

I couldn’t find corresponding information for the white connector, but by studying where the wires went, I deduced that the blue, red and purple wires were for the rain sensor – which my car didn’t have. Eliminating those three, all the other colours matched up except the brown. Nobody online seems sure what the brown wire is for but plenty of people were claiming it didn’t do anything or was safe to ignore – so I did.

I’m not much good at electronics but I managed to solder together the 5 matching wires and insulate them with heat shrink tube. Then I carefully insulated the cut-off brown, red, blue and purple wires to prevent shorts later on, and then covered the whole lot in more heat shrink tube. For those asking why I didn’t just release the crimped connector: I tried, but it was too hard and I don’t have the right tool.

It seems to work perfectly – if I cover the light sensor with my fingers, the mirror turns blue and dim and the headlights come on. My car doesn’t have the automatic wipers so they obviously don’t work anyway. I haven’t noticed anything bad happening from not connecting the brown wire to anything.

Dimming in action

So please don’t take my advice as gospel truth, because I’m just a guy with a blog. But in my experience, if you can’t find the right type of spare mirror, you can quite easily swap the yellow and white connectors and have a functional dimming mirror again.

Modernity vs Luxury

A few months ago I bought a 1997 Jaguar XJ8 and I’ve really enjoyed owning it. Owning an old car is interesting so I decided to compare it to the other vehicle I own – a 2015 Ford Mondeo. I wanted to see how top-of-the-range features from almost 25 years ago compare to a regular mid-range family car from the (nearly) present day, as technology has advanced. This is an article I wrote for fun, not to be taken too seriously!

The contenders

1997 Jaguar XJ8

The 1997 Jaguar XJ8 is a V8-engined luxury saloon car from the Jaguar XJ series (code-named X308). It is almost identical to its predecessor, the 1994 XJ6 (code-named X300) except for a couple of minor styling tweaks, and of course changing out the straight 6 engine for a V8. It shares many of its mechanicals with the 1994 XJ6 and the 1987 XJ6.

The XJ8 was designed and produced while Ford owned Jaguar and for this reason, some Jaguar purists don’t like the X300 and X308. I have no problem with it, because my other car is a…

2015 Ford Mondeo

The 2015 Ford Mondeo (known in North America as the Ford Fusion) is the fifth generation to be marketed in Europe. The Mondeo is a long-running series of family and executive cars but Ford have made the mk5 a little more upmarket, and are attempting to position it to compete with luxury car makers. There are a lot of optional extras that can be added, and little touches like a metal sill strip with the Mondeo name. The Mondeo has a new Vignale luxury trim level with all the extras, but I just have the Titanium which is somewhere in the middle of the range.

Mine has a 2-litre Diesel engine which was sold in three tune levels: 150PS and 180PS (148bhp and 177bhp) which are mechanically identical and differentiated only by a software setting, and 210PS (207bhp) which has a bi-turbo arrangement. Mine was a 150PS from the factory but I’ve had it remapped. It wasn’t tested on a dyno but applying a performance map to a 150/180PS model usually yields around 215PS, so I’ve just nabbed the specs from the stock 210PS model as they’re probably similar.

Exterior

The XJ8 and the Mondeo are both large cars, similar in size. The XJ8 is slightly longer and the Mondeo is slightly wider. The XJ8 has much squarer corners which you must keep in mind when maneouvering in tight spaces!

Both cars are much lower than the crossovers and SUVs that are common these days, particularly the XJ8. Getting into an XJ8 is a noticeable step down into the seat. Despite this, both cars have good road presence and you don’t feel too low on the road.

The styling is very different. The XJ8 had old-fashioned styling, even for its day, and is the last of the classic-looking Jaguars. Despite the long, gently curving lines going to front to back, the details are rounded: the lights, the grille, the edges, etc. To distinguish it as a luxury car, it has lots of chrome trim. The higher up the range you go, the more chrome it has. Mine, as an entry level XJ8 has the chrome grille, window frames and boot plinth. Higher-spec models have chrome wingmirrors, door handles and other stuff besides. The lights are classic style, circular lamps with reflectors.

The Mondeo is a mid-range car, and in keeping with trends of the time, most of the trim is body-coloured. It does have a chrome grille and chrome window frames, and personally I think these look great with the metallic blue paint, but the higher spec Mondeos have a black honeycomb grille. Lots of modders remove the chrome and replace it with black or carbon fibre trim. Like most modern cars, the Mondeo’s “face” looks a bit angry and aggressive. The styling is angular and aerodynamic, with lots of the features made to look like a performance car – like the large grille, the hint of front and rear splitters and a power bulge on the bonnet. Like many contemporary cars, it has exhaust ports, LED running lights and projector lenses on the headlights (still halogen bulbs though, no HID or LED here).

WeightLengthWidthHeight
Jaguar XJ81710 kg5024 mm1799 mm1314 mm
Ford Mondeo1597 kg4867 mm1852 mm1501 mm
Dimensions

Engine

The engines in these two cars are very different. The XJ8 has a 3.2 V8 petrol while the Mondeo has a 2.0 I4 turbocharged Diesel. Neither of these cars or engines are designed for spectacularly high performance, but the V8 in the Jag is designed for smoothness while the Diesel in the Mondeo is designed for economy.

The Jag’s engine has higher peak power, but the Mondeo’s has higher peak torque. The biggest difference here is the turbo lag. It takes the Mondeo a little while to build up to full boost in the turbocharger, while the Jag has access to its torque straight away. This difference is most obvious when moving off from standstill – the Jag can accelerate swiftly to 30mph with hardly any noise, while the Mondeo will go through a couple of gears as its redline is much lower.

The difference is clear when you hear these cars, and drive them. The Jag is very quiet at idle and when driving – it only really makes a noise if you thrash it. The Mondeo’s engine is hardly loud, but it is more audible inside the cabin as a deep rumble, and outside the car as a typical Diesel rattle.

DisplacementCylindersFuelGearboxPowerTorque
Jaguar XJ83248 cc8Petrol5 speed auto240 bhp316 Nm
Ford Mondeo1997 cc4Turbo Diesel6 speed manual207 bhp450 Nm
Engine

Interior

Inside, the two cars couldn’t be more different. The first thing you notice when you get in is that the Jag is much lower. The cream leather interior swallows you up like a comfy armchair. You are surrounded by panels of glossy wood. The Mondeo is not at all uncomfortable, but the black/grey fabric seats and plastic dashboard are a much more modern, minimalistic environment.

While both cars have similar external dimensions, the internal space feels very different. Both cars are spacious for the driver and front passenger but the thinner doors in the Jag maximise the width of the cabin. It feels like endless space between the two front seats. The Jag has a more vertical windscreen which is nearer to the driver – in contrast, the Mondeo’s windscreen is much more aerodynamic and you can barely reach it when seated.

The Mondeo has thicker doors, thicker pillars and a higher window line, which leads to a feeling of safety, security and being cocooned in the car. It can also make the cabin feel a little dark. Being older, the Jag has a low window line, large windows, thin doors and slender pillars. Visibility is excellent and the cabin is a light and airy place to be, even though the headlining is quite low. In my opinion, the large windows actually make the Jag easier to reverse, even though the Mondeo has parking sensors! Unlike in many modern cars, you can see the ends of the Jag’s bonnet and boot from the driver’s seat.

The interior is also where advances in technology are most obvious. The dashboard is very different. The Mondeo has an 8″ touch screen in the centre console, flanked by many buttons. The dials are screens which can be customised via a menu system. The Jag has much more technology than the average car of the late 90s, but still the dashboard has just three binnacles with mechanical dials in them and the centre console has a stereo with a few extra buttons for climate control.

I’m torn on this – I do like technology that works for me, but I also love the simplicity of the Jag’s user interface. There’s just no need to look away from the road at the myriad lights, buttons and screen information. It’s worth noting that the Jag has a digitally-controlled climate system which must have looked like a spaceship in the 90s. The only similarly-aged car I’ve owned is a 1997 Ford Escort which had a knob that went from blue to red.

In the back, the two cars are quite different. They both have bench seats that can seat three adults, but as my Jag is only the standard wheelbase, the rear legroom is not great. The Mondeo can comfortably accommodate tall adults (or bulky child seats). Both cars have adjustable rear air vents.

Finally, let’s have a look at all the interior technologies on both cars. The Mondeo easily outclasses the XJ8 in nearly every way related to technology. The Jag had many technologies fitted as advanced luxuries, ahead of their time. As the years have passed and technology has become cheaper and more ubiquitous, most of these are fitted to my modest spec Mondeo as standard.

Jaguar XJ8Ford Mondeo
YesElectric windowsYes
YesHeated front windscreenYes
6 CD changer, cassette, radioStereoTouchscreen CD, USB, Bluetooth, Aux, DAB
No*Cruise controlYes
No†NavigationYes
YesElectric adjustable wingmirrorsYes
NoFolding wing mirrorsYes
YesAuto headlightsYes
No*Auto wipersYes
YesAuto dim rear view mirrorYes
No†Parking sensorsYes
YesAir conditioningYes
YesHeated seatsNo*
YesElectrically adjustable seatsNo*
Technology

* Option on higher models
† Option on later models

While I have written that the XJ8 had navigation as an option on later models, it was a far cry from what we expect from navigation systems today. Check out this video which is an official VHS tape given to new Jaguar owners at the time for a demo of a bizarrely complex navigation system!

Performance

On paper, the two cars have surprisingly similar performance. However, that’s where the similarity ends.

The Jag is rear wheel drive while the Mondeo is front wheel drive, but I haven’t really driven these cars hard enough to tell the difference.

The Jag has tons of body roll, and very light steering. You need to turn the wheel a lot to turn the car. It doesn’t really pull the wheel back after you let go. I did once describe it as “handling like a bathtub of porridge”. You can’t really throw it around, but it almost feels disrespectful to do so. This is a car for cruising.

Likewise, the Mondeo is not designed for hard cornering, but it can do it if you push it. There’s a decent amount of power available once you get the revs high enough to make the turbo angry. The suspension is firmer and can take a bit of a beating but it’s hardly a sports coupé.

It’s probably best we don’t spend too long looking at the fuel consumption figures because I’ll start crying, but in my real-world experience the Mondeo gets about three times better fuel economy than the XJ8. I normally save the Jag for special occasions! It almost makes you wonder, the specs are so similar so what is the Jag doing with all that fuel?!

0-60 mph0-100 kmhTop speedUrban economyExtra-urban economy
Jaguar XJ88.1 s8.5 s140 mph17 mpg31 mpg
Ford Mondeo7.8 s8.1 s142 mph55 mpg68 mpg
Performance

Using TrueNAS to provide persistent storage for Kubernetes

A while ago I blogged about the possibilities of using Ceph to provide hyperconverged storage for Kubernetes. It works, but I never really liked the solution so I decided to look at dedicated storage solutions for my home lab and a small number of production sites, which would escape the single-node limitation of the MicroK8s storage addon and allow me to scale to more than one node.

In the end I settled upon TrueNAS (which used to be called FreeNAS but was recently renamed) as it is simple to set up and provides a number of storage options that Kubernetes can consume, both as block storage via iSCSI and file storage via NFS.

The key part is how to integrate Kubernetes with TrueNAS. It’s quite easy to mount an existing NFS or iSCSI share into a Kubernetes pod but the hard part is automating the creation of these storage resources with a provisioner. After some searching, I found a project called democratic-csi which describes itself as

democratic-csi implements the csi (container storage interface) spec providing storage for various container orchestration systems (ie: Kubernetes).

I was unfamiliar with Kubernetes storage and TrueNAS, but I found it quite easy to get started and the lead developer was super helpful while answering my questions. I thought it would be helpful to document and share my experience, so here’s my rough guide on how to set up storage on TrueNAS Core 12 with MicroK8s and democratic-csi.

TrueNAS

Pools

A complete guide to TrueNAS is outside the scope of this article, but basically you’ll need a working pool. This is configured in the Storage / Pools menu. In my case, this top-level pool is called hdd. I’ve got various things on my TrueNAS box so under hdd I created a dataset k8s. I wanted to provide both iSCSI and NFS, so under k8s I created more sub datasets iscsi and nfs. Brevity is important here, as we’ll see later.

Here’s what my dataset structure looks like – ignore backup and media:

TrueNAS pools

With your storage pools in place, it’s time to enable the services you need. I’m using both iSCSI and NFS, and I’ve started them running and also set them to start automatically (e.g. if the TrueNAS box is rebooted). Also check that SSH is enabled.

TrueNAS services

SSH

Kubernetes will need access to the TrueNAS API with a privileged user. This guide uses the root user for simplicity but in a production environment you should create a separate user with either a strong password, or a certificate.

You will also need to ensure that the user account used by Kubernetes to SSH to TrueNAS has a supported shell. The author of democratic-csi informs me it should be set to bash or sh, and on recent deployments of TrueNAS it defaults to csh, which won’t work.

To set the shell for your user, go to Accounts / Users and click on the user you’ll be using. Set the Shell to bash and hit Save.

NFS

The NFS service requires a little tweaking to make it work properly with Kubernetes. Access the NFS settings by clicking on the pencil icon in the Services menu. You must select Enable NFSv4, NFSv3 ownership model for NFSv4 and Allow non-root mount.

NFS configuration

iSCSI

The iSCSI service needs a little bit more setting up than NFS, and the iSCSI settings are in a different place, too. Look under Sharing / Block Shares (iSCSI). In short, you need to accept the default settings for almost everything until you have basic settings for Target Global Configuration, Portals and Initiator Groups until you have something that resembles these screenshots.

This was my first encounter with iSCSI and I found some of the terminology confusing to begin with. Roughly speaking:

  • a Portal is what would normally be called a server or a listener, i.e. you define the IP address and port to bind to. In this simple TrueNAS setup, we bind to all IPs (0.0.0.0) and accept the default port (3260). Authentication can also be set up here, but that is outside the scope of this guide.
  • an Initiator is what would normally be called a client
  • an Initiator Group allows you to define which Targets an Initiator can connect to. Here we will allow everything to connect, but you may wish to restrict that in the future.
  • a Target is a specific storage resource, analogous to a hard disk controller. These will be created automatically by Kubernetes as needed.
  • an Extent is the piece of storage that is referenced by a Target, analogous to a hard disk. These will be created automatically by Kubernetes as needed.
Target Global Configuration
Portals
Initiators

Kubernetes

There are no special requirements on the Kubernetes side of things, except a Helm 3 client. I have set this up on MicroK8s on single-node and multi-node clusters. It’s especially useful on multi-node clusters because the default MicroK8s storage addon allocates storage via hostPath on the node itself, which then ties your pod to that node forever.

In preparation for both the NFS and iSCSI steps, prepare your helm repo:

helm repo add democratic-csi https://democratic-csi.github.io/charts/
helm repo update
helm search repo democratic-csi/

NFS

First, we need to prepare all the nodes in the cluster to be able to use the NFS protocol.

# Fedora, CentOS, etc
sudo dnf -y install nfs-utils

# Ubuntu, Debian, etc
sudo apt install libnfs-utils

On Fedora/CentOS/RedHat you will either need to disable SELinux (not recommended) or load this custom SELinux policy to allow pods to mount storage:

# nfs-provisioner.te
module nfs-provisioner 1.0;

require {
	type snappy_t;
	type container_file_t;
	class dir { getattr open read rmdir };
}

#============= snappy_t ==============
allow snappy_t container_file_t:dir { getattr open read rmdir };
# Compile the above policy into a binary object
checkmodule -M -m -o nfs-provisioner.mod nfs-provisioner.te

# Package it
semodule_package -o nfs-provisioner.pp -m nfs-provisioner.mod

# Install it
semodule -i nfs-provisioner.pp

Finally we can install the FreeNAS NFS provisioner from democratic-csi! First fetch the example config so we can customise it for our environment:

wget https://raw.githubusercontent.com/democratic-csi/charts/master/stable/democratic-csi/examples/freenas-nfs.yaml

Most of the key values to change are all in the driver section. Anywhere where you see 192.168.0.4 here, replace with the IP or hostname of your TrueNAS server. Be sure to set nfsvers=4.

Note about NFSv4: it is possible to use NFSv3 here with democratic-csi and TrueNAS. In fact it is often recommended due to simpler permissions. However, on Fedora I ran into an issue with NFSv3 where in order for the client to work, the systemd unit rpc-statd has to be running. This cannot be enabled to start on boot, and it says it will automatically start when needed. However this did not happen for me, meaning if any of my nodes rebooted, they would come back unable to mount any NFS volumes. As a workaround, I opted to use NFSv4 which has a simpler daemon configuration.

If you have followed my naming convention for TrueNAS pools, you can also use my values for datasetParentName and detachedSnapshotsDatasetParentName. Otherwise, adjust to suit your environment. I found this a little confusing but in this simple case, these two values should be direct children of whatever your nfs dataset is. They will be created automatically – don’t create them yourself.

csiDriver:
  # should be globally unique for a given cluster
  name: "org.democratic-csi.nfs"

storageClasses:
- name: freenas-nfs-csi
  defaultClass: false
  reclaimPolicy: Delete
  volumeBindingMode: Immediate
  allowVolumeExpansion: true
  parameters:
    fsType: nfs

  mountOptions:
  - noatime
  - nfsvers=4
  secrets:
    provisioner-secret:
    controller-publish-secret:
    node-stage-secret:
    node-publish-secret:
    controller-expand-secret:

driver:
  config:
    driver: freenas-nfs
    instance_id:
    httpConnection:
      protocol: http
      host: 192.168.0.4
      port: 80
      username: root
      password: ************
      allowInsecure: true
    sshConnection:
      host: 192.168.0.4
      port: 22
      username: root
      # use either password or key
      password: "***********"
        #      privateKey: |
        #        -----BEGIN RSA PRIVATE KEY-----
        #        ...
        #        -----END RSA PRIVATE KEY-----
    zfs:
      datasetParentName: hdd/k8s/nfs/vols
      detachedSnapshotsDatasetParentName: hdd/k8s/nfs/snaps
      datasetEnableQuotas: true
      datasetEnableReservation: false
      datasetPermissionsMode: "0777"
      datasetPermissionsUser: root
      datasetPermissionsGroup: wheel
    nfs:
      shareHost: 192.168.0.4
      shareAlldirs: false
      shareAllowedHosts: []
      shareAllowedNetworks: []
      shareMaprootUser: root
      shareMaprootGroup: wheel
      shareMapallUser: ""
      shareMapallGroup: ""

Now we can install the NFS provisioner using Helm, based on the config file we’ve just created:

helm upgrade \
--install \
--create-namespace \
--values freenas-nfs.yaml \
--namespace democratic-csi \
--set node.kubeletHostPath="/var/snap/microk8s/common/var/lib/kubelet"  \
zfs-nfs democratic-csi/democratic-csi

iSCSI

First, we need to prepare all the nodes in the cluster to be able to use the iSCSI protocol.

# Fedora, CentOS, etc
sudo dnf install -y lsscsi iscsi-initiator-utils sg3_utils device-mapper-multipath
sudo mpathconf --enable --with_multipathd y
sudo systemctl enable --now iscsid multipathd
sudo systemctl enable --now iscsi

# Ubuntu, Debian, etc
sudo apt-get install -y open-iscsi lsscsi sg3-utils multipath-tools scsitools

sudo tee /etc/multipath.conf <<-'EOF'
defaults {
    user_friendly_names yes
    find_multipaths yes
}
EOF

sudo systemctl enable multipath-tools.service
sudo service multipath-tools restart
sudo systemctl enable open-iscsi.service
sudo service open-iscsi start

Finally we can install the FreeNAS iSCSI provisioner from democratic-csi! First fetch the example config so we can customise it for our environment:

wget https://raw.githubusercontent.com/democratic-csi/charts/master/stable/democratic-csi/examples/freenas-iscsi.yaml

The key values to change are all in the driver section. Anywhere where you see 192.168.0.4 here, replace with the IP or hostname of your TrueNAS server.

If you have followed my naming convention for TrueNAS pools, you can also use my values for datasetParentName and detachedSnapshotsDatasetParentName. Otherwise, adjust to suit your environment. I found this a little confusing but these two values should be direct children of whatever your iscsi dataset is. They will be created automatically.

Note that iSCSI imposes a limit on the length of the volume name. The total volume name (zvol/<datasetParentName>/<pvc name>) length cannot exceed 63 characters. The standard volume naming overhead is 46 characters, so datasetParentName should therefore be 17 characters or less.

csiDriver:
  # should be globally unique for a given cluster
  name: "org.democratic-csi.iscsi"

# add note here about volume expansion requirements
storageClasses:
- name: freenas-iscsi-csi
  defaultClass: false
  reclaimPolicy: Delete
  volumeBindingMode: Immediate
  allowVolumeExpansion: true
  parameters:
    # for block-based storage can be ext3, ext4, xfs
    fsType: xfs

  mountOptions: []
  secrets:
    provisioner-secret:
    controller-publish-secret:
    node-stage-secret:
    node-publish-secret:
    controller-expand-secret:

driver:
  config:
    driver: freenas-iscsi
    instance_id:
    httpConnection:
      protocol: http
      host: 192.168.0.4
      port: 80
      username: root
      password: *************
      allowInsecure: true
      apiVersion: 2
    sshConnection:
      host: 192.168.0.4
      port: 22
      username: root
      # use either password or key
      password: ******************
        #      privateKey: |
        #        -----BEGIN RSA PRIVATE KEY-----
        #        ...
        #        -----END RSA PRIVATE KEY-----
    zfs:
      # the example below is useful for TrueNAS 12
      cli:
        paths:
          zfs: /usr/local/sbin/zfs
          zpool: /usr/local/sbin/zpool
          sudo: /usr/local/bin/sudo
          chroot: /usr/sbin/chroot
      # total volume name (zvol/<datasetParentName>/<pvc name>) length cannot exceed 63 chars
      # https://www.ixsystems.com/documentation/freenas/11.2-U5/storage.html#zfs-zvol-config-opts-tab
      # standard volume naming overhead is 46 chars
      # datasetParentName should therefore be 17 chars or less
      datasetParentName: hdd/k8s/iscsi/v
      detachedSnapshotsDatasetParentName: hdd/k8s/iscsi/s
      # "" (inherit), lz4, gzip-9, etc
      zvolCompression:
      # "" (inherit), on, off, verify
      zvolDedup:
      zvolEnableReservation: false
      # 512, 1K, 2K, 4K, 8K, 16K, 64K, 128K default is 16K
      zvolBlocksize:
    iscsi:
      targetPortal: "192.168.0.4:3260"
      targetPortals: []
      # leave empty to omit usage of -I with iscsiadm
      interface:
      namePrefix: csi-
      nameSuffix: "-cluster"
      # add as many as needed
      targetGroups:
        # get the correct ID from the "portal" section in the UI
        - targetGroupPortalGroup: 1
          # get the correct ID from the "initiators" section in the UI
          targetGroupInitiatorGroup: 1
          # None, CHAP, or CHAP Mutual
          targetGroupAuthType: None
          # get the correct ID from the "Authorized Access" section of the UI
          # only required if using Chap
          targetGroupAuthGroup:
      extentInsecureTpc: true
      extentXenCompat: false
      extentDisablePhysicalBlocksize: true
      # 512, 1024, 2048, or 4096,
      extentBlocksize: 4096
      # "" (let FreeNAS decide, currently defaults to SSD), Unknown, SSD, 5400, 7200, 10000, 15000
      extentRpm: "7200"
      # 0-100 (0 == ignore)
      extentAvailThreshold: 0

Testing

There are a few sanity checks you should do. First make sure all the democratic-csi pods are healthy across all your nodes:

[jonathan@zeus ~]$ kubectl get pods -n democratic-csi -o wide
NAME                                                   READY   STATUS    RESTARTS   AGE     IP             NODE       
zfs-iscsi-democratic-csi-node-pdkgn                    3/3     Running   6          7d3h    192.168.0.44   zeus-kube02
zfs-iscsi-democratic-csi-node-g25tq                    3/3     Running   12         7d3h    192.168.0.45   zeus-kube03
zfs-iscsi-democratic-csi-node-mmcnm                    3/3     Running   0          2d15h   192.168.0.2    zeus.jg.lan
zfs-iscsi-democratic-csi-controller-5888fb7c46-hgj5c   4/4     Running   0          2d15h   10.1.27.131    zeus.jg.lan
zfs-nfs-democratic-csi-controller-6b84ffc596-qv48h     4/4     Running   0          24h     10.1.27.136    zeus.jg.lan
zfs-nfs-democratic-csi-node-pdn72                      3/3     Running   0          24h     192.168.0.2    zeus.jg.lan
zfs-nfs-democratic-csi-node-f4xlv                      3/3     Running   0          24h     192.168.0.44   zeus-kube02
zfs-nfs-democratic-csi-node-7jngv                      3/3     Running   0          24h     192.168.0.45   zeus-kube03

Also make sure your storageClasses are present, and set one as the default if you like:

[jonathan@zeus ~]$ kubectl get sc
NAME                        PROVISIONER                RECLAIMPOLICY   VOLUMEBINDINGMODE   ALLOWVOLUMEEXPANSION   AGE
microk8s-hostpath           microk8s.io/hostpath       Delete          Immediate           false                  340d
freenas-iscsi-csi           org.democratic-csi.iscsi   Delete          Immediate           true                   26d
freenas-nfs-csi (default)   org.democratic-csi.nfs     Delete          Immediate           true                   26d

Now we’re ready to create some test volumes:

# test-claim-iscsi.yaml
kind: PersistentVolumeClaim
apiVersion: v1
metadata:
  name: test-claim-iscsi
  annotations:
    volume.beta.kubernetes.io/storage-class: "freenas-iscsi-csi"
spec:
  storageClassName: freenas-iscsi-csi
  accessModes:
    - ReadWriteOnce
  resources:
    requests:
      storage: 1Gi
# test-claim-nfs.yaml
kind: PersistentVolumeClaim
apiVersion: v1
metadata:
  name: test-claim-nfs
  annotations:
    volume.beta.kubernetes.io/storage-class: "freenas-nfs-csi"
spec:
  storageClassName: freenas-nfs-csi
  accessModes:
    - ReadWriteOnce
  resources:
    requests:
      storage: 1Gi

Use the above test manifests to create some persistentVolumeClaims:

[jonathan@zeus ~]$ kubectl -n democratic-csi create -f test-claim-iscsi.yaml -f test-claim-nfs.yaml
persistentvolumeclaim/test-claim-iscsi created
persistentvolumeclaim/test-claim-nfs created

Then check that your PVCs are showing as Bound. This should only take a few seconds, so if your PVCs are showing as Pending, something has probably gone wrong.

[jonathan@zeus ~]$ kubectl -n democratic-csi get pvc
NAME               STATUS   VOLUME                                     CAPACITY   ACCESS MODES   STORAGECLASS        AGE
test-claim-nfs     Bound    pvc-0ca8bbf4-33e9-4c3a-8e27-6a3022194ec3   1Gi        RWX            freenas-nfs-csi     119s
test-claim-iscsi   Bound    pvc-9bd9228e-d548-48ea-9824-2b96daf29cd3   1Gi        RWO            freenas-iscsi-csi   119s

Verify that the new volumes or filesystems are showing up as datasets in TrueNAS:

Provisioned volumes in TrueNAS

Likewise verify that NFS shares, or iSCSI targets and extents have been created:

NFS shares
iSCSI targets
iSCSI extents

Clean up your test PVCs:

[jonathan@zeus ~]$ kubectl -n democratic-csi delete -f test-claim-iscsi.yaml -f test-claim-nfs.yaml
persistentvolumeclaim "test-claim-iscsi" deleted
persistentvolumeclaim "test-claim-nfs" deleted

Double-check that the volumes, shares, targets and extents have been cleaned up.

Load-balancing Ingress with MetalLB on MicroK8s

Out of the box, the MicroK8s distribution of ingress-nginx installed as the MicroK8s addon ingress binds to ports 80+443 on the node’s IP address using a hostPort, as we can see here on line 20:

microk8s kubectl -n ingress describe daemonset.apps/nginx-ingress-microk8s-controller
Name:           nginx-ingress-microk8s-controller
Selector:       name=nginx-ingress-microk8s
Node-Selector:  
Labels:         microk8s-application=nginx-ingress-microk8s
Annotations:    deprecated.daemonset.template.generation: 1
Desired Number of Nodes Scheduled: 4
Current Number of Nodes Scheduled: 4
Number of Nodes Scheduled with Up-to-date Pods: 4
Number of Nodes Scheduled with Available Pods: 4
Number of Nodes Misscheduled: 0
Pods Status:  4 Running / 0 Waiting / 0 Succeeded / 0 Failed
Pod Template:
  Labels:           name=nginx-ingress-microk8s
  Service Account:  nginx-ingress-microk8s-serviceaccount
  Containers:
   nginx-ingress-microk8s:
    Image:       quay.io/kubernetes-ingress-controller/nginx-ingress-controller-amd64:0.25.1
    Ports:       80/TCP, 443/TCP
    Host Ports:  80/TCP, 443/TCP
    Args:
      /nginx-ingress-controller
      --configmap=$(POD_NAMESPACE)/nginx-load-balancer-microk8s-conf
      --publish-status-address=127.0.0.1
    Liveness:  http-get http://:10254/healthz delay=30s timeout=5s period=10s #success=1 #failure=3
    Environment:
      POD_NAME:        (v1:metadata.name)
      POD_NAMESPACE:   (v1:metadata.namespace)
    Mounts:           
  Volumes:            
Events:               

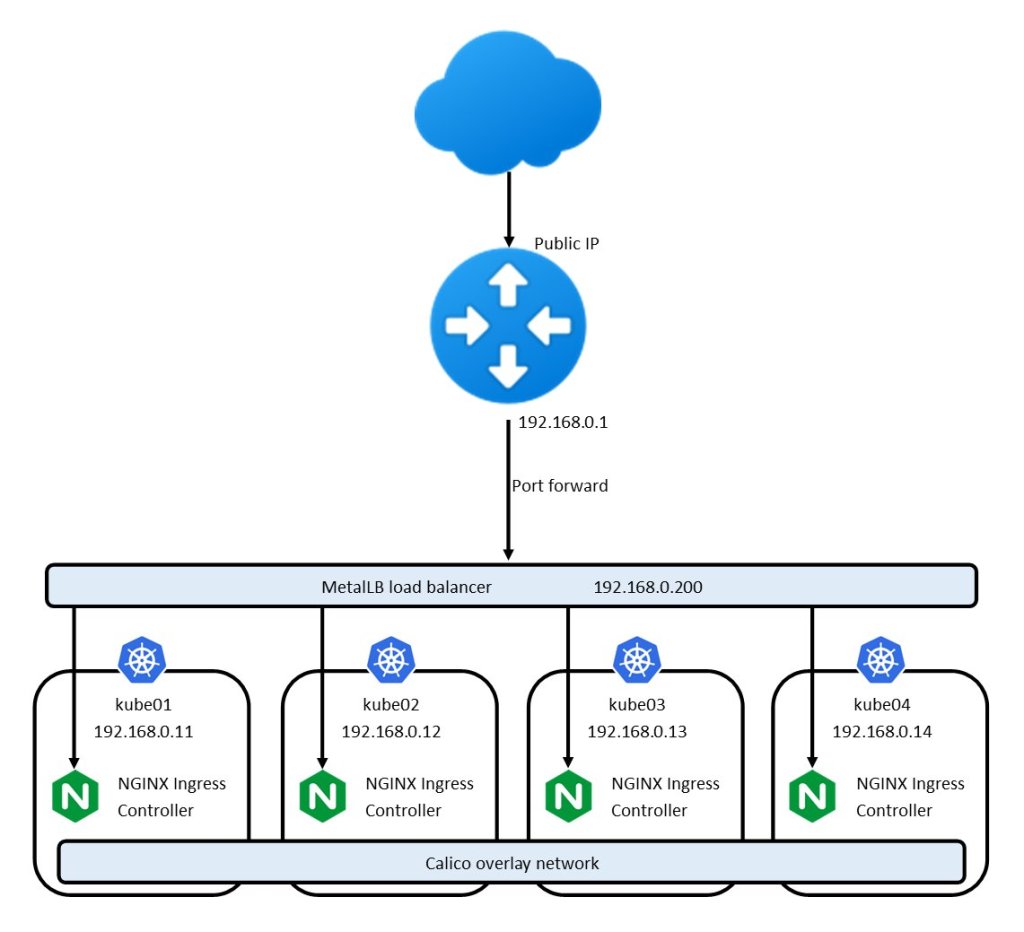
This is fine for a single-node deployment, but now MicroK8s supports clustering we need to find a way of load-balancing our Ingress, as a multi-node cluster will have one Ingress controller per node, each bound to its own node’s IP.

Enter MetalLB, a software load-balancer which works well in layer 2 mode, which is also available as a MicroK8s addon metallb. We can use MetalLB to load-balance between the ingress controllers.

There’s one snag though, MetalLB requires a Service resource, and the MicroK8s distribution of Ingress does not include one.

microk8s kubectl -n ingress get svc
No resources found in ingress namespace.

This gist contains the definition for a Service which should work with default deployments of the MicroK8s addons Ingress and MetalLB. It assumes that both of these addons are already enabled.

microk8s enable ingress metallb

Download this manifest ingress-service.yaml

apiVersion: v1
kind: Service
metadata:
  name: ingress
  namespace: ingress
spec:
  selector:
    name: nginx-ingress-microk8s
  type: LoadBalancer
  # loadBalancerIP is optional. MetalLB will automatically allocate an IP from its pool if not
  # specified. You can also specify one manually.
  # loadBalancerIP: x.y.z.a
  ports:
    - name: http
      protocol: TCP
      port: 80
      targetPort: 80
    - name: https
      protocol: TCP
      port: 443
      targetPort: 443

Apply it to your cluster with:

microk8s kubectl apply -f ingress-service.yaml

Now there is a load-balancer which listens on an arbitrary IP and directs traffic towards one of the listening ingress controllers. In this case, MetalLB has picked 192.168.0.61 as the load-balanced IP so I can route my traffic here.

microk8s kubectl -n ingress get svc
NAME      TYPE           CLUSTER-IP       EXTERNAL-IP    PORT(S)                      AGE
ingress   LoadBalancer   10.152.183.141   192.168.0.61   80:30029/TCP,443:30276/TCP   24h

This content is also available as a Github gist.

Exposing the Kubernetes Dashboard with an Ingress

With MicroK8s it’s easy to enable the Kubernetes Dashboard by running

microk8s enable dashboard

If you’re running MicroK8s on a local PC or VM, you can access the dashboard with kube-proxy as described in the docs, but if you want to expose it properly then the best way to do this is with an Ingress resource.

Firstly, make sure you’ve got the Ingress addon enabled in your MicroK8s.

microk8s enable ingress

HTTP

The simplest case is to set up a plain HTTP Ingress on port 80 which presents the Dashboard. However this is not recommended as it is insecure.

---
apiVersion: extensions/v1beta1
kind: Ingress
metadata:
  annotations:
    kubernetes.io/ingress.class: nginx
    nginx.ingress.kubernetes.io/backend-protocol: "HTTPS"
  name: dashboard
  namespace: kube-system
spec:
  rules:
  - host: <your-external-address>
    http:
      paths:
      - backend:
          serviceName: kubernetes-dashboard
          servicePort: 443
        path: /

HTTPS

For proper security we should serve the Dashboard via HTTPS on port 443. However there are some prerequisites:

  • You need to set up Cert Manager
  • You need to set up Let’s Encrypt as an Issuer so you can provision TLS certificates (included below)
  • You need to use a fully-qualified domain name that matches the common name of your certificate, and it must be in DNS
---
apiVersion: cert-manager.io/v1alpha2
kind: Issuer
metadata:
  name: letsencrypt-prod
spec:
  acme:
    # The ACME server URL
    server: https://acme-v02.api.letsencrypt.org/directory
    # Email address used for ACME registration
    email: youremail@example.com
    # Name of a secret used to store the ACME account private key
    privateKeySecretRef:
      name: letsencrypt-prod
       # Enable the HTTP-01 challenge provider
    solvers:
    - http01:
        ingress:
           class: nginx
---
apiVersion: extensions/v1beta1
kind: Ingress
metadata:
  annotations:
    cert-manager.io/issuer: letsencrypt-prod
    kubernetes.io/ingress.class: nginx
    nginx.ingress.kubernetes.io/backend-protocol: "HTTPS"
  name: dashboard
  namespace: kube-system
spec:
  rules:
  - host: dashboard.example.com
    http:
      paths:
      - backend:
          serviceName: kubernetes-dashboard
          servicePort: 443
        path: /
  tls:
  - hosts:
    - dashboard.example.com
    secretName: dashboard-ingress-cert

After applying this manifest, wait for the certificate to be ready:

$ kubectl get certs -n kube-system
NAME                     READY   SECRET                   AGE
dashboard-ingress-cert   True    dashboard-ingress-cert   169m

Building a hyperconverged Kubernetes cluster with MicroK8s and Ceph

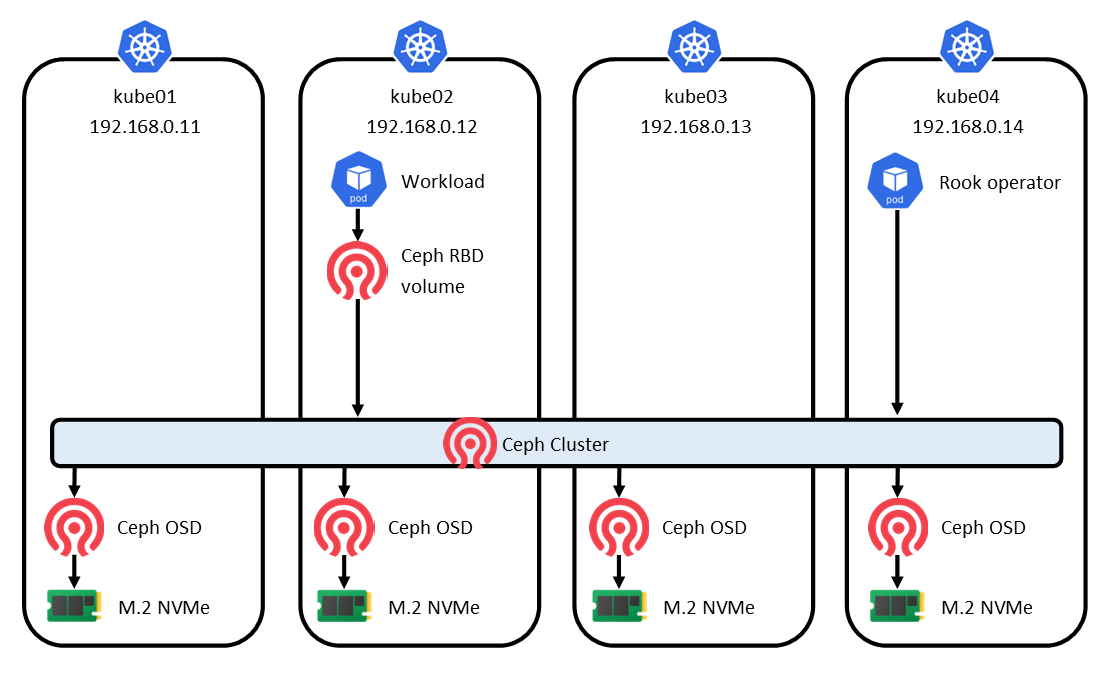
This guide explains how to build a highly-available, hyperconverged Kubernetes cluster using MicroK8s, Ceph and MetalLB on commodity hardware or virtual machines. This could be useful for small production deployments, dev/test clusters, or a nerdy toy.

Other guides are available – this one is written from a sysadmin point of view, focusing on stability and ease of maintenance. I prefer to avoid running random scripts or fetching binaries that are then unmanaged and unmanageable. This guide uses package managers and operators wherever possible. I’ve also attempted to explain each step so readers can gain some understanding instead of just copying and pasting the commands. However, this does not absolve you from having a decent background of the components, and it is strongly recommended that you are familiar with kubectl/Kubernetes and Ceph in particular.

The technological landscape moves so fast so these instructions may become outdated quickly. I’ll link to upstream documentation wherever possible so you can check for updated versions.

Finally, this is a fairly simplistic guide that gives you the minimum possible configuration. There are many other components and configurations that you can add, and it also takes no account of security with RBAC etc.

Hardware

There are a few of considerations when choosing your hardware or virtual “hardware” for use as Kubernetes nodes.

  • MicroK8s requires at least 3 nodes to work in HA mode, so we’ll start with 3 VMs
  • While MicroK8s is quite lightweight, by the time you start adding the storage capability you will need a reasonable amount of memory. Recommended minimum spec for this guide is 2 CPUs and 4GB RAM. More is obviously better, depending on your workload.
  • Each VM will need two block devices (disks). One should be partitioned, formatted and used as a normal OS disk, and the other should be left untouched so it can be claimed by Ceph later. The OS disk will also contain cached container images so could get quite large. I’ve allowed 16GB for the OS disk, and Ceph requires a minimum of 10GB for its disk.
  • If running in VirtualBox, place all VMs either in the same NAT network, or bridged to the host network. Ideally have static IPs.
  • If you are running on bare metal, make sure the machines are on the same network, or at least on networks that can talk to each other.

In my case, I used VirtualBoxc and created 3 identical VMs, kube01, kube02 and kube03.

Operating system

This guide focuses on CentOS/Fedora but should be applicable to many distributions with minor tweaks. I have started with a CentOS 8 minimal installation. Fedora Server or Ubuntu Server would also work just as well but you’ll need to tweak some of the commands.

  • Don’t create a swap partition on these machines
  • Make sure ntp is enabled for accurate time
  • Make sure the VMs have static IPs or DHCP reservations, so their IPs won’t change

Snap

Reference: https://snapcraft.io/docs/installing-snap-on-centos

Snap is a package manager that contains MicroK8s. It comes preinstalled on Ubuntu, but if you’re on CentOS, Fedora or others, you’ll need to install it on all your nodes.

sudo dnf -y install epel-release
sudo dnf -y install snapd
sudo systemctl enable --now snapd
sudo ln -s /var/lib/snapd/snap /snap

MicroK8s

Reference: https://microk8s.io/

MicroK8s is a lightweight, pre-packaged Kubernetes distribution which is easy to use and works well for small deployments. It’s a lot more straightforward than following Kubernetes the hard way.

Install

Install MicroK8s 1.19.1 or greater from Snap on all your nodes:

sudo snap install microk8s --classic --channel=latest/edge
microk8s status --wait-ready
echo 'alias kubectl="microk8s kubectl"' >> ~/.bashrc

The first time you run microk8s status, you will be prompted to add your user to the microk8s group. Follow the instructions and log in again.

Enable HA mode

Reference: https://microk8s.io/docs/high-availability

Enable MicroK8s HA mode on all nodes, which allows any of the worker nodes to also behave as a master, instead of just being a worker node. This must be enabled before nodes are joined to the master. On some versions of MicroK8s this is enabled by default. https://microk8s.io/docs/high-availability

microk8s enable ha-cluster

Add firewall rules

Reference: https://microk8s.io/docs/ports

Create firewall rules for your nodes, so they can communicate with each other.

Enable clustering

Reference: https://microk8s.io/docs/clustering

Enable Microk8s clustering, which allows you to add multiple worker nodes to your existing master node

Run this on the first node only:

[jonathan@kube01 ~]$ microk8s add-node
From the node you wish to join to this cluster, run the following:
microk8s join 192.168.0.41:25000/xxxxxxxxxxxxxxxxxxxxxxxxxxxxxxxx

Then execute the join command on the second node, to join it to the master.

[jonathan@kube02 ~]$ microk8s join 192.168.0.41:25000/xxxxxxxxxxxxxxxxxxxxxxxxxxxxxxxx
Contacting cluster at 192.168.0.41
Waiting for this node to finish joining the cluster. ..

Repeat for the third node and remember to run the add-node command for each node you add, so they all get a unique token.

Verify that they are correctly joined:

[jonathan@kube01 ~]$ kubectl get nodes
NAME                         STATUS   ROLES    AGE   VERSION
kube01.jonathangazeley.com   Ready    <none>   35h   v1.19.1-34+08a87c75adb55c
kube03.jonathangazeley.com   Ready    <none>   35h   v1.19.1-34+08a87c75adb55c
kube02.jonathangazeley.com   Ready    <none>   35h   v1.19.1-34+08a87c75adb55c

Finally make sure that full HA mode is enabled:

[jonathan@kube01 ~]$ microk8s status
microk8s is running
high-availability: yes
  datastore master nodes: 192.168.0.41:19001 192.168.0.42:19001 192.168.0.43:19001
  datastore standby nodes: none
addons:
  enabled:
...

Addons

Reference: https://microk8s.io/docs/addon-dns

Reference: https://kubernetes.io/docs/reference/access-authn-authz/rbac/

Enable some basic addons across the cluster to provide a usable experience. Run this on any one node.

microk8s enable dns rbac

Check

We’ve already checked that all 3 nodes are up. Now let’s make sure pods are being scheduled on all nodes:

[jonathan@kube01 ~]$ kubectl get pods --all-namespaces -o wide
NAMESPACE     NAME                                                READY   STATUS              RESTARTS   AGE    IP             NODE                      
kube-system   calico-node-bqqqd                                   1/1     Running             0          112m   192.168.0.41   kube01.jonathangazeley.com
kube-system   calico-node-z4sxd                                   1/1     Running             0          110m   192.168.0.43   kube03.jonathangazeley.com
kube-system   calico-kube-controllers-847c8c99d-4qblz             1/1     Running             0          115m   10.1.58.1      kube01.jonathangazeley.com
kube-system   coredns-86f78bb79c-t2sgt                            1/1     Running             0          109m   10.1.111.65    kube02.jonathangazeley.com
kube-system   calico-node-t5skc                                   1/1     Running             0          111m   192.168.0.42   kube02.jonathangazeley.com

With the cluster in a health and operational state, let’s add the hyperconverged storage. From now on, all steps can be run on kube01.

Ceph

Ceph is a clustered storage engine which can present its storage to Kubernetes as block storage or a filesystem. We will use the Rook operator to manage our Ceph deployment.

Install

Reference: https://rook.io/docs/rook/v1.4/ceph-quickstart.html

These steps are taken verbatim from the official Rook docs. Check the link above to make sure you are using the latest version of Rook.

First we install the Rook operator, which automates the rest of the Ceph installation.

git clone --single-branch --branch release-1.4 https://github.com/rook/rook.git
cd rook/cluster/examples/kubernetes/ceph
kubectl create -f common.yaml
kubectl create -f operator.yaml
kubectl -n rook-ceph get pod

Wait until the rook-ceph-operator pod and the rook-discover pods are all Running. This took a few minutes for me. Then we can create the actual Ceph cluster.

kubectl create -f cluster.yaml
kubectl -n rook-ceph get pod

This command will probably take a while – be patient. The operator creates various pods including canaries, monitors, a manager, and provisioners. There will be periods where it looks like it isn’t doing anything, but don’t be tempted to intervene. You can check what the operator is doing by reading its log:

kubectl -n rook-ceph logs rook-ceph-operator-775d4b6c5f-52r87

Check

Reference: https://rook.io/docs/rook/v1.4/ceph-toolbox.html

Install the Ceph toolbox and connect to it so we can run some checks.

kubectl create -f toolbox.yaml
kubectl -n rook-ceph exec -it $(kubectl -n rook-ceph get pod -l "app=rook-ceph-tools" -o jsonpath='{.items[0].metadata.name}') bash

OSDs are the individual pieces of storage. Make sure all 3 are available and check the overall health of the cluster.

[root@rook-ceph-tools-6967fc698d-5f4sh /]# ceph status
  cluster:
    id:     e37a9364-b2e4-42ba-a7c0-c7276bc2083d
    health: HEALTH_OK
 
  services:
    mon: 3 daemons, quorum a,b,d (age 2m)
    mgr: a(active, since 33s)
    osd: 3 osds: 3 up (since 89s), 3 in (since 89s)
 
  data:
    pools:   1 pools, 1 pgs
    objects: 0 objects, 0 B
    usage:   3.0 GiB used, 45 GiB / 48 GiB avail
    pgs:     1 active+clean
[root@rook-ceph-tools-6967fc698d-5f4sh /]# ceph osd status
ID  HOST                         USED  AVAIL  WR OPS  WR DATA  RD OPS  RD DATA  STATE      
 0  kube03.jonathangazeley.com  1027M  14.9G      0        0       0        0   exists,up  
 1  kube02.jonathangazeley.com  1027M  14.9G      0        0       0        0   exists,up  
 2  kube01.jonathangazeley.com  1027M  14.9G      0        0       0        0   exists,up  

Block storage

Reference: https://rook.io/docs/rook/v1.4/ceph-block.html

Ceph can provide persistent block storage to Kubernetes as a storage class which can be consumed by one pod at any one time.

kubectl create -f csi/rbd/storageclass.yaml

Verify that the block storageclass is available:

[jonathan@kube01 ~]$ kubectl get storageclass
NAME                PROVISIONER                  RECLAIMPOLICY   VOLUMEBINDINGMODE   ALLOWVOLUMEEXPANSION   AGE
rook-ceph-block     rook-ceph.rbd.csi.ceph.com   Delete          Immediate           true                   3m53s

Filesystem

Reference: https://rook.io/docs/rook/v1.4/ceph-filesystem.html

Ceph can provide persistent storage which can be consumed across multiple pods simultaneously by providing a filesystem layer.

kubectl create -f filesystem.yaml

Use the toolbox again to verify that there is a metadata service (mds) available:

[root@rook-ceph-tools-6967fc698d-5f4sh /]# ceph status
  cluster:
    id:     e37a9364-b2e4-42ba-a7c0-c7276bc2083d
    health: HEALTH_OK
 
  services:
    mon: 3 daemons, quorum a,b,d (age 36m)
    mgr: a(active, since 34m)
    mds: myfs:1 {0=myfs-b=up:active} 1 up:standby-replay
    osd: 3 osds: 3 up (since 35m), 3 in (since 35m)
 
  task status:
    scrub status:
        mds.myfs-a: idle
        mds.myfs-b: idle
 
  data:
    pools:   4 pools, 97 pgs
    objects: 22 objects, 2.2 KiB
    usage:   3.0 GiB used, 45 GiB / 48 GiB avail
    pgs:     97 active+clean
 
  io:
    client:   852 B/s rd, 1 op/s rd, 0 op/s wr

Now we can create a new storageclass based on the filesystem:

kubectl create -f csi/cephfs/storageclass.yaml

Verify the storageclass is present:

[jonathan@kube01 ceph]$ kubectl get storageclass
NAME                        PROVISIONER                     RECLAIMPOLICY   VOLUMEBINDINGMODE   ALLOWVOLUMEEXPANSION   AGE
rook-ceph-block (default)   rook-ceph.rbd.csi.ceph.com      Delete          Immediate           true                   49m
rook-cephfs                 rook-ceph.cephfs.csi.ceph.com   Delete          Immediate           true                   34m

Consume

It’s easy to consume the new Ceph storage. Use the storageClassName rook-ceph-block in ReadWriteOnce mode for persistent storage for a single pod, or rook-cephfs in ReadWriteMany mode for persistent storage that can be shared between pods.

---
apiVersion: v1
kind: PersistentVolumeClaim
metadata:
  name: ceph-rbd-pvc
  labels:
spec:
  storageClassName: rook-ceph-block
  accessModes:
  - ReadWriteOnce
  resources:
    requests:
      storage: 20Gi
---
apiVersion: v1
kind: PersistentVolumeClaim
metadata:
  name: cephfs-pvc
spec:
  storageClassName: rook-cephfs
  accessModes:
  - ReadWriteMany
  resources:
    requests:
      storage: 1Gi

Ingress

Reference: https://microk8s.io/docs/addon-ingress

Probably the simplest way to expose web applications on your cluster is to use an Ingress. This binds to ports 80+443 on all your nodes and listens for http+https requests. It will effectively do name-based virtual hosting, terminate your SSL and will direct your web traffic to a Kubernetes Service with an internal ClusterIP which acts as a simple load balancer. This will require you to set up external round robin DNS to point your A record at all 3 of the node IPs.

microk8s enable ingress
sudo firewall-cmd --permanent --add-service http
sudo firewall-cmd --permanent --add-service https
sudo firewall-cmd --reload

MetalLB

Reference: https://microk8s.io/docs/addon-metallb

If you want to set up more advanced load balancing, consider using MetalLB. It will load balance your Kubernetes Service and present it on a single virtual IP.

Install

MetalLB will prompt you for one or more ranges of IPs that it can use for load-balancing. It should be fine to accept the default suggestion.

[jonathan@kube01 ~]$ microk8s enable metallb
Enabling MetalLB
Enter each IP address range delimited by comma (e.g. '10.64.140.43-10.64.140.49,192.168.0.105-192.168.0.111'): 10.64.140.43-10.64.140.49,192.168.0.105-192.168.0.111

Consume

Once MetalLB is installed and configured, to expose a service externally, simply create it with spec.type set to LoadBalancer, and MetalLB will do the rest.

It’s important to note that in the default config, the vIP will only appear on one of your nodes and that node will act as the entry point for all traffic before it gets load balanced between nodes, so this could be a bottleneck in busy environments.

---
apiVersion: v1
kind: Service
metadata:
  name: nginx
spec:
  ports:
  - port: 80
    targetPort: 80
  selector:
    app: nginx
  type: LoadBalancer

Summary

You now have a fully-featured Kubernetes cluster with high availability, clustered storage, ingress, and load balancing. The possibilities are endless!

If you spot any mistakes, improvements or versions that need updating, please drop a comment below.

Canon New FD 35-70mm lenses

In the late 1970s and early 1980s, Canon released these two similar lenses as part of their New FD series – both 35-70mm zoom lenses. But what’s the difference between these two lenses, and which is better?

First, let’s cover the similarities. These are both compact zoom lenses with the same focal lengths from the New FD lineup, with bayonet mount instead of the original FD lenses with their silver breech ring. They are both double-touch zoom lenses, with separate rings for zoom and focus.

The key difference between them is their aperture – at first glance the smaller lens has the slightly faster aperture of f/3.5-4.5 while the larger lens has an aperture of f/4.

However, the f/4 version can manage f/4 at all focal lengths while the f/3.5-4.5 version can only manage f/3.5 at 35mm, falling to f/4.5 at 70mm.

There are obvious physical differences, too. The f/4 version is longer and heavier as it seems to have more metal components. The f/3.5-4.5 version feels plasticky in comparison.

Specifications

Let’s have a look at the specs on paper and see what they reveal.

New FD 35-70mm f/4New FD 35-70mm f/3.5-4.5
June 1979MarketedMarch 1983
45,000 yenOriginal Price31,900 yen
8/8Elements/Groups9/8
6Diaphragm blades8
22Minimum aperture22
0.5mClosest Focusing Distance0.5m
0.15×Maximum Magnification0.15×
52mmFilter Diameter52mm
63 × 84.5mmMax Diameter × Length63 × 60.9mm
315gWeight200g

Looking at these specifications is a mixed bag. The optical formula is very similar but has been altered, with the addition of an extra element, which is presumably to improve image quality.

As already mentioned, the new lens weighs less and uses more plastic, which is consistent with camera design in the 1980s. We can see that it was priced lower at launch. But it also has a greater number of diaphragm blades – something which is usually associated with more expensive lenses.

A little bit of context

Let’s take a moment to consider the context that these lenses were marketed in. The f/4 model was marketed in 1979, just one year after the New FD system was launched in 1978. There was a flood of new lenses and improved versions of existing ones, but this 35-70mm f/4 was a new design. Cameras released around this time include the A-1 and AV-1, which both included 50mm prime lenses as their “kit” lens (50mm f/1.4 and 50mm f/2.0 respectively). So this zoom lens was a premium item marketed as an upgrade.

Meanwhile, the f/3.5-4.5 lens was released in 1983 with the T50. The T series were the first Canon cameras to openly embrace the use of plastics, and were much lighter. This lens appeared as the kit lens on the T50 and the T70 the following year.

My verdict

I haven’t done any thorough side-by-side testing of these lenses but I think they are both pretty decent performers.

Going by the rest of the data, the earlier f/4 is the superior lens as it occupied a higher position in the lineup, and the f/3.5-4.5 was built to a budget as a kit lens. It’s a more solid lens and probably has slightly better image quality.

However, I would still pick the f/3.5-4.5 over the f/4 if I needed a small and light lens to go with a small and light camera.

CameraHub

If you like nerding out over camera and lens data, you should check out CameraHub. It’s a public database of camera and lens data that anyone can edit and add to. It’s browseable and searchable but to get you started, here are a few links to cameras and lenses mentioned in this article:

Rethinking database architecture

Originally published 2015-09-02 on the UoB Unix blog

The eduroam wireless network has a reliance on a database for the authorization and accounting parts of AAA (authentication, authorization and accounting – are you who you say you are, what access are you allowed, and what did you do while connected).

When we started dabbling with database-backed AAA in 2007 or so, we used a centrally-provided Oracle database. The volume of AAA traffic was low and high performance was not necessary. However (spoiler alert) demand for wireless connectivity grew and before many months, we were placing more demand on Oracle than it could handle. The latency of our queries was taking sufficiently long that some wireless authentication requests would time out and fail.

First gen – MySQL (2007)

It was clear that we needed a dedicated database platform, and at the time that we asked, the DBAs were not able to provide a suitable platform. We went down the route of implementing our own. We decided to use MySQL as a low-complexity open source database server with a large community. The first iteration of the eduroam database hardware was a single second-hand server that was going spare. It had no resilience but was suitably snappy for our needs.

First gen database

Second gen – MySQL MMM (2011)

Demand continued to grow but more crucially eduroam went from being a beta service that was “not to be relied upon” to being a core service that users routinely used for their teaching, learning and research. Clearly a cobbled-together solution was no longer fit for purpose, so we went about designing a new database platform.

The two key requirements were high query capacity, and high availability, i.e. resilience against the failure of an individual node. At the time, none of the open source database servers had proper clustering – only master-slave replication. We installed a clustering wrapper for MySQL, called MMM (MySQL Multi Master). This gave us a resilient two-node cluster whether either node could be queried for reads and one node was designated the “writer” at any one time. In the event of a node failure, the writer role would be automatically moved around by the supervisor.

Second gen database

Not only did this buy us resilience against hardware faults, for the first time it also allowed us to drop either node out of the cluster for patching and maintenance during the working day without affecting service for users.

The two-node MMM system served us well for several years, until the hardware came to its natural end of life. The size of the dataset had grown and exceeded the size of the servers’ memory (the 8GB that seemed generous in 2011 didn’t really go so far in 2015) meaning that some queries were quite slow. By this time, MMM had been discontinued so we set out to investigate other forms of clustering.

Third gen – MariaDB Galera (2015)

MySQL had been forked into MariaDB which was becoming the default open source database, replacing MySQL while retaining full compatibility. MariaDB came with an integrated clustering driver called Galera which was getting lots of attention online. Even the developer of MMM recommended using MariaDB Galera.

MariaDB Galera has no concept of “master” or “slave” – all the nodes are masters and are considered equal. Read and write queries can be sent to any of the nodes at will. For this reason, it is strongly recommended to have an odd number of nodes, so if a cluster has a conflict or goes split-brain, the nodes will vote on who is the “odd one out”. This node will then be forced to resync.

This approach lends itself naturally to load-balancing. After talking to Netcomms about the options, we placed all three MariaDB Galera nodes behind the F5 load balancer. This allows us to use one single IP address for the whole cluster, and the F5 will direct queries to the most appropriate backend node. We configured a probe so the F5 is aware of the state of the nodes, and will not direct queries to a node that is too busy, out of sync, or offline.

Having three nodes that can be simultaneously queried gives us an unprecedented capacity which allows us to easily meet the demands of eduroam AAA today, with plenty of spare capacity for tomorrow. We are receiving more queries per second than ever before (240 per second, and we are currently in the summer vacation!).

We are required to keep eduroam accounting data for between 3 and 6 months – this means a large dataset. While disk is cheap these days and you can store an awful lot of data, you also need a lot of memory to hold the dataset twice over, for UPDATE operations which require duplicating a table in memory, making changes, merging the two copies back and syncing to disk. The new MariaDB Galera nodes have 192GB memory each while the size of the dataset is about 30GB. That should keep us going… for now.

Service availability monitoring with Nagios and BPI

Originally published  2016-11-21 on the UoB Unix blog

Several times, senior management have asked Team Wireless to provide an uptime figure for eduroam. While we do have an awful lot of monitoring of systems and services, it has never been possible to give a single uptime figure because it needs some detailed knowledge to make sense of the many Nagios checks (currently 2704 of them).

From the point of view of a Bristol user on campus here, there are three services that must be up for eduroam to work: RADIUS authentication, DNS, and DHCP. For the purposes of resilience, the RADIUS service for eduroam is provided by 3 servers, DNS by 2 servers and DHCP by 2 servers. It’s hard to see the overall state of the eduroam service from a glance at which systems and services are currently up in Nagios.

Nagios gives us detailed performance monitoring and graphing for each system and service but has no built-in aggregation tools. I decided to use an addon called Business Process Intelligence (BPI) to do the aggregation. We built this as an RPM for easy deployment, and configured it with Puppet.

BPI lets you define meta-services which consist of other services that are currently in Nagios. I defined a BPI service called RADIUS which contains all three RADIUS servers. Any one RADIUS server must be up for the RADIUS group to be up. I did likewise for DNS and DHCP.

BPI also lets meta-services depend on other groups. To consider eduroam to be up, you need the RADIUS group and the DNS group and the DHCP group to be up. It’s probably easier to see what’s going on with a screenshot of the BPI control panel:

BPI control panel

So far, these BPI meta-services are only visible in the BPI control panel and not in the Nagios interface itself. The BPI project does, however, provide a Nagios plugin check_bpi which allows Nagios to monitor the state of BPI meta-services. As part of that, it will draw you a table of availability data.

eduroam uptime

So now we have a definitive uptime figure to the overall eduroam service. How many nines? An infinite number of them! 😉 (Also, I like the fact that “OK” is split into scheduled and unscheduled uptime…)

This availability report is still only visible to Nagios users though. It’s a few clicks deep in the web interface and provides a lot more information than is actually needed. We need a simpler way of obtaining this information.

So I wrote a script called nagios-report which runs on the same host as Nagios and generates custom availability reports with various options for output formatting. As an example:

$ sudo /usr/bin/nagios-report -h bpi -s eduroam -o uptime -v -d
Total uptime percentage for service eduroam during period lastmonth was 100.000%

This can now be run as a cron job to automagically email availability reports to people. The one we were asked to provide is monthly, so this is our crontab entry to generate it on the first day of each month:

# Puppet Name: eduroam-availability
45 6 1 * * nagios-report -h bpi -s eduroam -t lastmonth -o uptime -v -d

It’s great that our work on resilience has paid off. Just last week (during the time covered by the eduroam uptime table) we experienced a temporary loss of about a third of our VMs, and yet users did not see a single second of downtime. That’s what we’re aiming for.