Part 4 of this series was supposed to cover hyperconverged storage with OpenEBS and cStor, but while I was in the middle of writing that guide, it all exploded and I lost data, so the blog post turned into an anti-recommendation for various reasons.
I’ve now redesigned my architecture using Rook/Ceph and it has had a few weeks to bed in, so let’s cover that today as a pattern that I’m happy recommending.
Ceph architecture
First, let’s have a brief look at Rook/Ceph architecture and topology, and clear up some of the terminology. I’ll keep it as short as I can – if you need more detail, check out the Ceph architecture guide and glossary.
Ceph is a long-standing software-defined clustered storage system, and also exists outside of Kubernetes. Rook is a Kubernetes operator that installs and manages Ceph on Kubernetes. On Kubernetes, people seem to interchangeably use the terms Rook, Ceph, and Rook/Ceph to refer to the whole system.
Ceph has many components to make up its stack. We don’t need to know about all of them here – partly because we don’t need to use all of them, and partly because Rook shields us from much of the complexity.
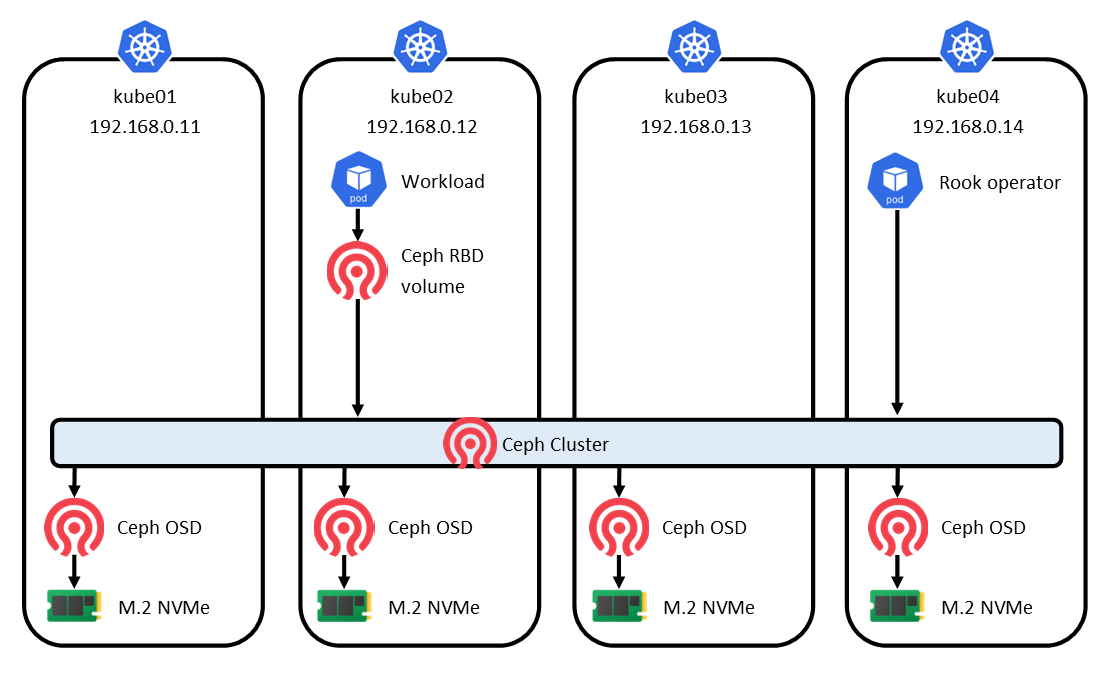
The most fundamental component of Ceph is the OSD (object storage daemon). Ceph runs exactly one OSD for each storage device available to the cluster. In my case, I have 4 NVMe devices, so I also have 4 OSDs – one per node. These run as pods. The OSD can only claim an entire storage device, separate from what you’re booting the node OS from. My nodes each have a SATA SSD for the OS and an NVMe for Ceph.
The part of my diagram that I have simply labelled Ceph Cluster consists of several components, but the key components are Monitors (mons). Monitors are the heart of the cluster, as they decide which pieces of data get written to each OSD, and maintain that mapping. Monitors run as pods and 3 are required to maintain quorum.
At its core, a Ceph cluster has a distributed object storage system called RADOS (Reliable Autonomic Distributed Object Store) – not to be confused with S3-compatible object storage. Everything is stored as a RADOS object. In order to actually use a Ceph cluster, an additional presentation layer is required, and 3 are available:
- Ceph Block Device (aka RADOS Block Device, RBD) – a block device image that can be mounted by one pod as
ReadWriteOnce - Ceph File System (aka CephFS) – a POSIX-compliant filesystem that can be mounted by multiple pods as
ReadWriteMany - Ceph Object Store (aka RADOS Gateway, RGW) – an S3-compatible gateway backed by RADOS

As I already have a ReadWriteMany storage class provided by TrueNAS, and I don’t need S3 object storage, I’m only going to enable RBD to provide block storage, mostly for databases which don’t play nicely with NFS.
Deployment
As everything else on my cluster is deployed with Helm, I will also deploy Rook with Helm. It’s a slightly strange method as you have to install two Helm charts.
The first chart installs the Rook Ceph Operator, and sets up Ceph CRDs (custom resource definitions). The operator waits to be fed a CR (custom resource) which describes a Ceph cluster and its config.
The second chart generates and feeds in the CR, which the operator will use create the cluster and provision OSDs, Monitors and the other components.
I’m using almost entirely the default values from the charts. The only things I have customised are to:
- enable RBD but disable CephFS and RGW
- set appropriate requests & limits for my cluster (Ceph can be quite hungry)
- to define which devices Ceph can claim By default, Ceph will claim all unused block devices in all nodes, which is a reasonable default. As all my Ceph devices are NVMe, there is only one in each node, and I’m not using NVMe for anything else, I can play it a bit safer by disabling
useAllDevicesand specifying adeviceFilter. I would need to change this if I had a node with multiple NVMes, or if I wanted to introduce a SATA device into the cluster.
cephClusterSpec:
  storage:
    useAllNodes: true
    useAllDevices: false
    deviceFilter: "^nvme0n1"
Resources
As I mentioned above, a Ceph cluster can consume quite a lot of CPU and memory resources (which is one of the reasons I started off with cStor). Here’s a quick snapshot of the actual CPU and memory usage by Ceph in my cluster, which is serving 14 Ceph block volumes to a handful of not-very-busy databases.
$ kubectl top po -n rook-ceph
NAME                                         CPU   MEMORY
csi-rbdplugin-6s42w                          1m    80Mi
csi-rbdplugin-l75kh                          1m    23Mi
csi-rbdplugin-provisioner-694f54898b-67nnf   1m    47Mi
csi-rbdplugin-provisioner-694f54898b-s9vpx   7m    108Mi
csi-rbdplugin-pvhcx                          1m    76Mi
csi-rbdplugin-vt7gs                          1m    20Mi
rook-ceph-crashcollector-kube05-65d87b7d8b   0m    6Mi
rook-ceph-crashcollector-kube06-64b798c4bc   0m    6Mi
rook-ceph-crashcollector-kube07-887878456    0m    6Mi
rook-ceph-crashcollector-kube08-688f948ddf   0m    6Mi
rook-ceph-exporter-kube05-b6d6c6c9c-splt6    1m    16Mi
rook-ceph-exporter-kube06-f9757c848-j47qm    1m    6Mi
rook-ceph-exporter-kube07-5bdbb94f47-8kt8d   2m    16Mi
rook-ceph-exporter-kube08-c98496b8b-8tnrz    3m    16Mi
rook-ceph-mgr-a-6cb6484ff7-9gh8r             54m   571Mi
rook-ceph-mgr-b-686bcb7f66-5nkvp             70m   446Mi
rook-ceph-mon-a-86cbcbcfc7-6bsn6             28m   428Mi
rook-ceph-mon-b-579f857b7f-rkkpc             23m   407Mi
rook-ceph-mon-d-59f97f97-9r4b8               25m   427Mi
rook-ceph-operator-6bcf46667-gv426           39m   57Mi
rook-ceph-osd-0-77c56c774c-2jtff             24m   959Mi
rook-ceph-osd-1-67df8f6ccd-4qbrw             28m   1386Mi
rook-ceph-osd-2-66cf8c8f55-6m6zt             31m   1310Mi
rook-ceph-osd-3-74f794b458-hbhvr             31m   1296Mi
rook-ceph-tools-c679447fc-cjpcs              3m    2Mi
There are quite a few pods in this deployment but the heaviest memory usage is by the OSDs, which consume over 1Gi each (my nodes have 16Gi RAM each). Bear this in mind if you’re running on a more lightweight cluster.
None of the pods have high CPU usage, but the Monitor pods tends to spike a little during activity (such as provisioning a new volume).
To save you the adding up, this is a total of 375m CPU (or 2% of the total cluster CPU) and 7721Mi memory (or 12% of the total cluster memory). Bear this in mind… it’s not exactly lightweight.
Monitoring
The Rook/Ceph Helm chart comes with metrics endpoints and Prometheus rules which I enabled. I then added the Ceph Cluster Grafana dashboard for an out-of-the-box dashboard.

The only problem I have found with this dashboard is the Throughput and IOPS counters towards the top-left usually display 0 even when this is not true, and intermittently show the real numbers, before returning to zero. Likewise, the IOPS and Throughput graphs in the middle always register 0, and don’t record the spikes. I haven’t had a chance to look at this yet.
You can see that my cluster isn’t being stressed at all, and I’m sure any storage experts are laughing at my rookie numbers. My OSDs are inexpensive consumer-grade NVMe devices, each of which claims performance up to 1700 MB/s throughput and 200,000 IOPS and a clustered systems can theoretically beat this, so I’m nowhere near any limits.
One thing to note is the available capacity. Ceph aggregates the size of all OSDs into a pool (4 × 256GB ≈ 1TB) but doesn’t account for the fact that it also stores multiple replicas of each object it stores (this is configurable). The default is 3 replicas, so a 1MB object would consume 3MB of the total capacity. My 1TB pool will actually store about 333GB of data.
Support
It’s hard to make a meaningful assessment of the support available for Rook/Ceph, but as lack of support was a key reason for abandoning OpenEBS/cStor it makes sense to have a look.
Ceph is a more mature product, and its documentation is more complete. There are pages about disaster recovery and detailed guides on how to restore/replace OSDs that break. There is also the Ceph Toolbox which provides a place to run the ceph command to perform a variety of maintenance and repair tasks.
Remember my problem with cStor wasn’t cStor’s fault – it was the Kubernetes control plane that lost quorum, and cStor used Kubernetes’ data store for its own state. This made it very hard to recover a cStor cluster. I was then unable to create a new cStor cluster and adopt the existing volumes, and no support was available to help me do that.
The Kubernetes control plane could explode again, so how would this affect Ceph? Sneakily, Ceph doesn’t use the Kubernetes data store for its state – it keeps it in /var/lib/rook on the host filesystem of each node. In the event of total cluster loss, it would be possible to create a new Kubernetes cluster and for Ceph to discover its state from the node filesystem.
$ tree -d /var/lib/rook
/var/lib/rook
├── exporter
├── mon-c
│   └── data
│       └── store.db
└── rook-ceph
    ├── crash
    │   └── posted
    ├── d4ec2a82-4b19-4b03-a4e0-7951a45eec35_47391857-0c95-4b47-9ab9-41721e101eff
    ├── e7b6c3ad-b460-4e77-9b5f-3522bc69c1e8_0d464f95-e171-4bed-b785-03c665b8e411
    └── log
In fact, as Ceph can work outside of Kubernetes, if for some reason a new Kubernetes cluster can’t be created, it should be possible to install Ceph right on the node OS, tell it where to find its state, and tell it where the local NVMe devices are. Ceph block devices can be mounted manually on the node as /dev/rbd0 similarly to iSCSI. It’s sketchy, but it should be OK to temporarily reconstruct a Ceph cluster, to pull the data off it. I’m not saying I would enjoy doing it, but it would an option in an emergency.
Lastly, I know of quite a few large corporations using Ceph, and it also forms the basis of Red Hat’s OpenShift Data Foundation product. This gives me confidence in its reliability.

Great write up… a few comments.
“Ceph runs exactly one OSD for each storage device available to the cluster.” – true for spinning rust. However, one OSD per NVMe will not be able to max out the throughput capacity of NVMe. Probably not a problem, but as NVME get larger and faster if speed becomes a concern and memory allows it, then 2 to 4 OSD’s per NVMe is probably needed. That said I use one OSD per NVMe as well, as I do not need raw speed of NVMe. I’ll be limited by the 2.5GbE networking between my nodes before I can come close to NVMe saturation anyway.
“The OSD can only claim an entire storage device” – I use them with partitions. For 1TB NVMe, I allocate 300GB for the node OS and Kubernetes and 700GB partitions as an OSD. All my nodes which support more storage, get an additional OSD for that device. Again, I use partitions to keep amount of space roughly the same to help keep placement groups balanced. To the paragraph above, if you needed more throughput one way to get more OSDs per device is to break it up into partitions. (Still keeping the failure domain at the host level).
“As I already have a ReadWriteMany storage class provided by TrueNAS” – I did as well, but once I got trust in Rook/Ceph I converted these as well and removed the democratic-csi NFS deployment. I just use TrueNAS for bulk storage (media files, music, pictures, etc) mounted as NFS volumes. I also don’t use Ceph S3 storage. But I do backup the ceph storage to TrueNAS via S3 service running on TrueNAS and use Velero for that.
“set appropriate requests & limits for my cluster” – word of caution with this. Don’t base your values on when the cluster is happy any everything is working smoothly. The resources consumption ramps up during disk scrubs and recovery operations. Low CPU limits can drag this process out a while. Obviously the goal is to minimize recovery times to keep redundancy within the cluster. And when doing node drains and uncordon operations you don’t want your good nodes getting OOM killed due to low memory limits. Overtime, I had to keep bumping up my limits.
I have the same problems with the Ceph Grafana dashboard. Sometimes the numbers work, sometimes they don’t. Seems to get better results on small time ranges like 15 or 30 minutes. Anything in the scale of hours come up as zeros. You didn’t talk about the Ceph Dashboard within Rook. Expose that via ingress, works really well and it has its own integration to Grafana to get per OSD, per node, metrics.
“It’s hard to make a meaningful assessment of the support available for Rook/Ceph” – Rook Github discussion area has been fantastic. Ask an informed question and people help. I’ve had to use it several times, community support has been fantastic. Had a few glitches during upgrades (never data loss) and they have been responsive to issues opened. Some issues are Ceph and not Rook and they can’t help much with that, but often there are known workarounds.
As a side note, if you select Host Networking at install time (can’t really switch once installed), then computers outside the cluster can mount cluster storage as well. I like to use CephFS for this instead of shares on TrueNAS. TrueNAS is a single point of failure, Rook is not. External desktop, laptops, etc can connect to any nodes running a ceph-mon pod.
As I’m sure you found out, the more nodes you have in your cluster, the more OSD’s you add the lower the number of placement groups per OSD the faster Rook Ceph gets. Faster serving data, faster recovery times, less likely hood of data loss as more redundancy is available.
LikeLiked by 1 person
Thanks for sharing your wisdom!
I stand corrected on OSDs == devices, I hadn’t realised you could have multiple OSDs on a device. Like you, I don’t need the speed – I just need something fairly low latency that’s not NFS.
I’ll probably keep my TrueNAS deployment as it is. It’s running on an HP MicroServer N40L which wouldn’t have the grunt to run Ceph, and I also use it for non-Kubernetes purposes. Yes, it’s a single point of failure in terms of HA, but my primary goal is data safety rather than pure uptime. And to date, it’s been bulletproof!
Good point about the requests & limits. Off the top of my head I set the requests low and left the limits at their defaults. With most other deployments on my cluster I have not set limits so I’ll probably remove them from Rook/Ceph too.
I happen to have already used Host Networking for Ceph, because I ran into some problems I never understood trying to install Rook with the default overlay networking. I also wondered if performance would be better cos host networking, although my nodes only have 1Gb NICs.
LikeLike
Thanks also for the tip about the Ceph Dashboard. I’d heard of it but never looked at it. The Helm chart has broken-by-default settings for the Ingress but once I’d fixed that I got to see the dashboard. And interestingly, my Grafana graphs for Throughput and IOPS sprung into action around the same time. Probably more likely to do with the mons/managers being restarted by the operator, rather than any specific change.
LikeLike
What do you use for those diagrams?
LikeLike
I’m using Dia. It’s pretty basic, but it’s sufficient 😃
LikeLike