I recently received an Ecowitt WS2910 weather station for Fathers’ day. I’ve always wanted a weather station so I was very excited. This isn’t supposed to be a review of the product, but I think it would be helpful to go over the basics before we dive into the meat of this blog post (the integration with Prometheus).

The outdoor portion of this weather station (model number WS69 if you buy it separately) measures wind speed, wind direction, temperature, humidity, rainfall and solar irradiation. It takes AA batteries which are supposed to last for 2-3 years as it gets the bulk of its power from the solar panel during daylight hours. There are several different Ecowitt weather stations which include the same sensor array.
The sensor array communicates with the indoor base unit periodically, via UHF radio. My model uses 868MHz but judging by the box, there are at least 4 different frequencies available for different parts of the world. The base unit doesn’t need pairing with the outdoor part like a Bluetooth connection – it just waits for the next radio signal to come in and starts displaying data.
The base station is simple but effective. It shows almost all the information you want on the main screen (not a touch screen), and there are several touch-sensitive buttons that let you change view or look at old data. This is a bit fiddly, so I’m just using it as a “current status” dashboard and not touching the buttons. It’s also not a true colour screen, but a backlit LCD which seems to have coloured filters over the backlight to illuminate each section.
Ecowitt sell several different WiFi-enabled base stations and the main differentiator seems to be the size and quality of the screen. All of the models that have WiFi appear to behave the same way when it comes to data logging and integration with various online weather services. At the time of writing, everything from here onwards in this blog post should apply at least to the following models (and I’d love to hear from you if you find this works or doesn’t work for your model):
- Ecowitt WS2910 with colour LCD display (this one)
- Ecowitt WS2320 with mono LCD display
- Ecowitt HP2551 with colour TFT display
- Ecowitt HP3500B with colour TFT display
- Ecowitt GW1101 headless weather station, no display
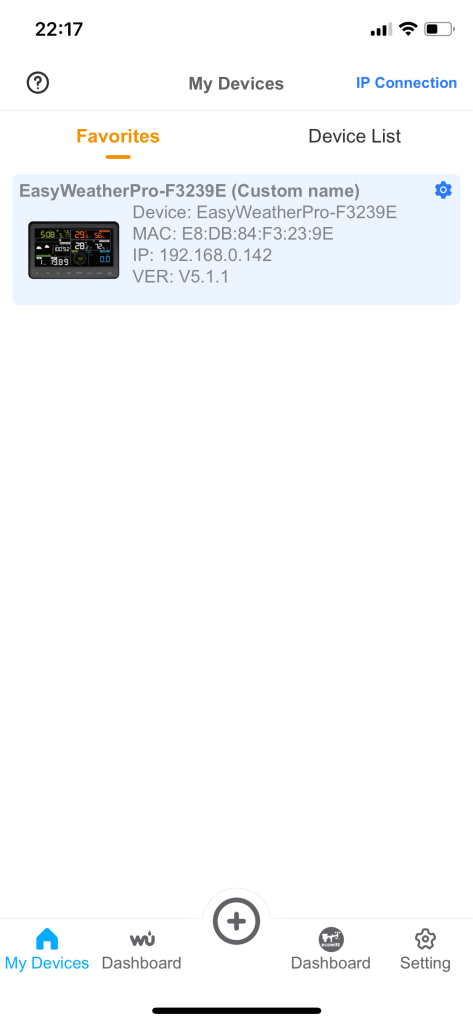
What I’m really interested in are the different options for integrations. There’s a smartphone app called WSView Plus (for iOS and Android) which pairs with the base station via local WiFi and allows you to configure your real WiFi network name and passphrase. It also allows you to set up integrations with various weather services, including the manufacturer’s own service Ecowitt Weather, Weather Underground, Weathercloud, and the Met Office.


The Ecowitt Weather service requires authentication to see the weather data, so it’s no use for sharing with other people. Weather Underground has a nice dashboard which is publicly available, so I registered as station IBRIST302.
There is also the option for a “custom” integration to send weather data to a custom endpoint. There are no details in the manual about the format of the protocol but from reading it seems that the Ecowitt weather station sends the data as an HTTP POST request with form encoded data.
I had a look around to see if anyone else had already written a tool that could receive data from the Ecowitt for local processing:
- https://github.com/bentasker/Ecowitt_to_InfluxDB
- https://github.com/pa3hcm/ecowither
- https://github.com/Slocan/weatherDashboard
Almost all of the existing solutions very sensibly use InfluxDB, and that’s probably what you should use if you don’t have any existing infrastructure. However, I don’t want to run a new service unless I have to – and I already have a Prometheus instance that I want to import the weather data into. So I set about writing an exporter that could receive the HTTP POST requests from the weather station, transform the data where necessary, and present it where it can be scraped by Prometheus.
In the end I took parts of pa3hcm/ecowither and parts of bentasker/Ecowitt_to_InfluxDB, removed the InfluxDB bits and added the official Prometheus Python client to create an exporter. I included code to select output in Metric/SI or Imperial, and to toggle this independently for each instrument, to cope with the slightly odd “hybrid British units”, because we like most things in metric, except for wind speed, which we prefer in mph.
I did run into a bug where a malformed HTTP header being sent by the Ecowitt on firmware version v5.1.1 was causing bad behaviour in Flask. At the time of writing there is a PR in the pipeline to fix this, but I worked around the problem by fronting my Flask server with an NGINX reverse proxy – no special config required. NGINX seems to magically fix the broken header in flight.
My effort is excitingly named ecowitt-exporter and is available as a Docker image too.
But wait! That’s not all. If you simply run ecowitt-exporter, all it does is host an HTTP endpoint and waits for Prometheus to scrape it, which you will have to configure manually.
But as I’m running Kubernetes, I’m also running the Prometheus Operator which supports automatically configuring Prometheus to scrape targets based on the ServiceMonitor custom resource. I created an ecowitt-exporter Helm chart which installs ecowitt-exporter and configures a ServiceMonitor resource to enable scraping. It can optionally also configure an Ingress (which at the moment is required, to work around the header bug described above).
The last piece of the puzzle is a Grafana dashboard to visualise this data. I’ve tried to recreate the basic information shown on the weather station base unit, but with history. The top row is a “conditions right now” view, while all the other rows show 24 hours history (customisable).
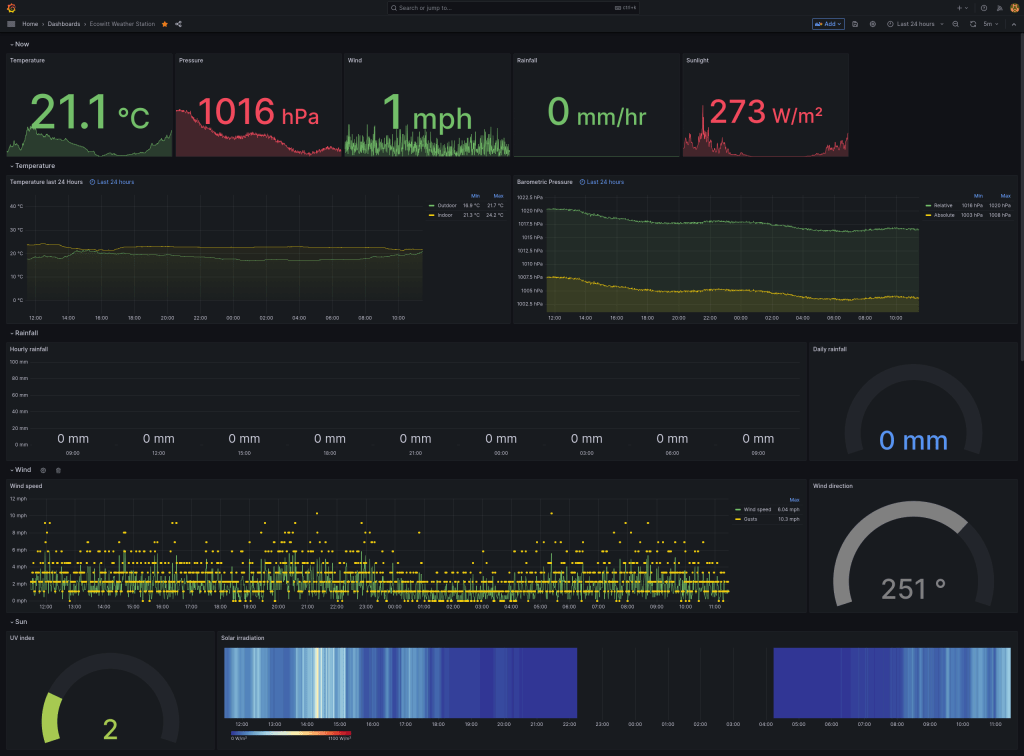
At the time of writing, this dashboard is still evolving so I haven’t published it on Grafana’s list of community dashboards, but you can grab it from my git repo. It should “just work” if you are using the ecowitt-exporter for Prometheus. If you are using Grafana to visualise data from InfluxDB, this dashboard will need minor modification as the data sources will probably have different names.
All of these components are open source, so improvements, bug fixes, and new features are welcome.

Thanks for putting this together, super useful! I have my ecowitt (gw1001) connected to homeassistant and am using the homeassistant -> prometheus integration to ship metrics to grafana. I have to tweak where I’m getting the datapoints, but it’s really nice to have the dashboard widgets all setup (i just need to modify each one to grab the right data).
LikeLike